WHY THIS SITE?

This site is intended to help people looking for a better understanding of the development, technical support and consulting activities that I have practiced over the last few decades. It is aimed at providing the greatest possible degree of information, while safeguarding the property rights of the contracting companies of the various projects. Thanks in advance for any comments and criticisms.

RECENTLY VISITED
CONTACT INFO
  • Address: Rua Jandaia, 78
    São Paulo - SP - Brazil
  • Phone: +55 (11) 93009-4801
  • Email: msantrax@gmail.com

Activity UI Structure - Operational Regions

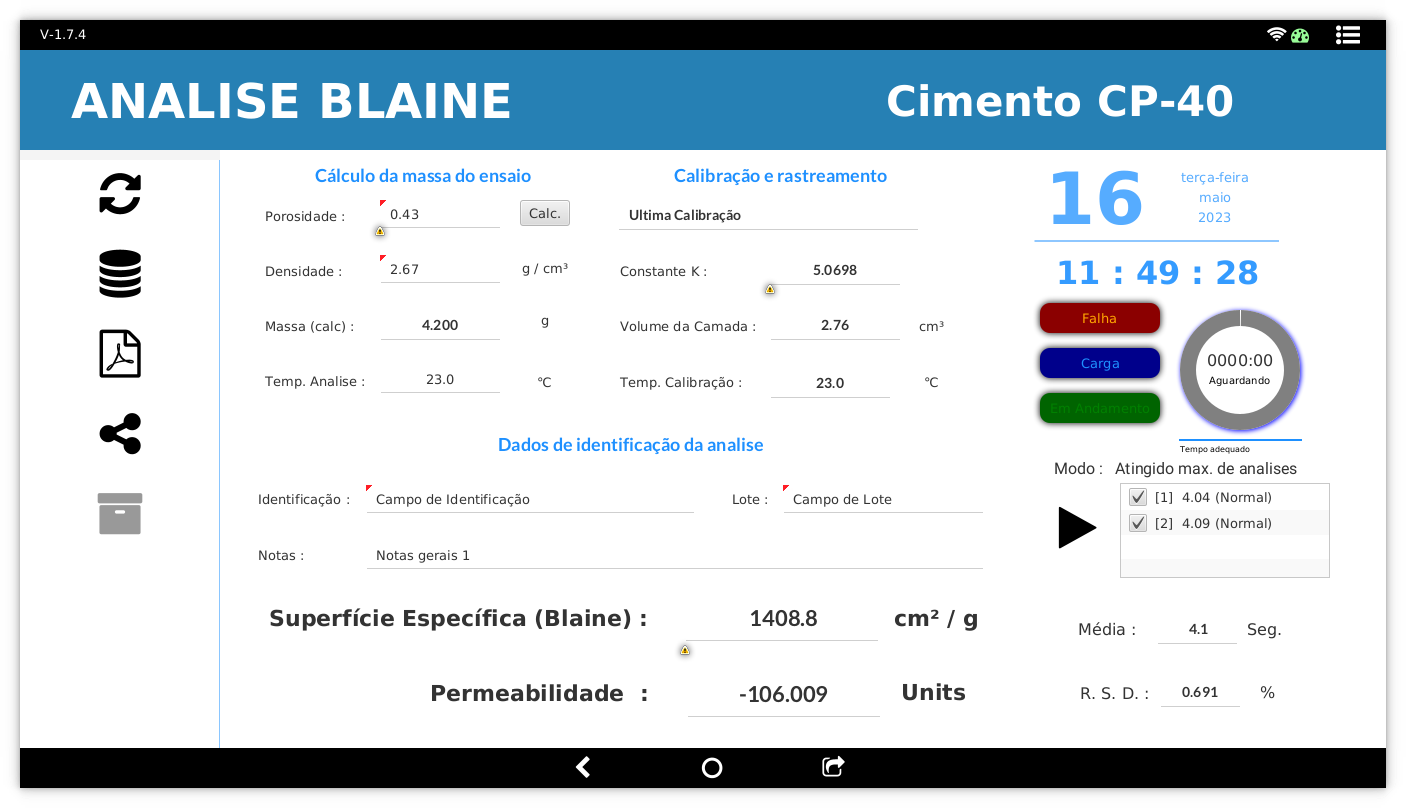
This section tells you about the structure used by the activity to communicate with the analyst. Below we may observe a tipical activity interface used on the Blaine Measurement Instrument (PP200 Project):

Functional regions on the activity

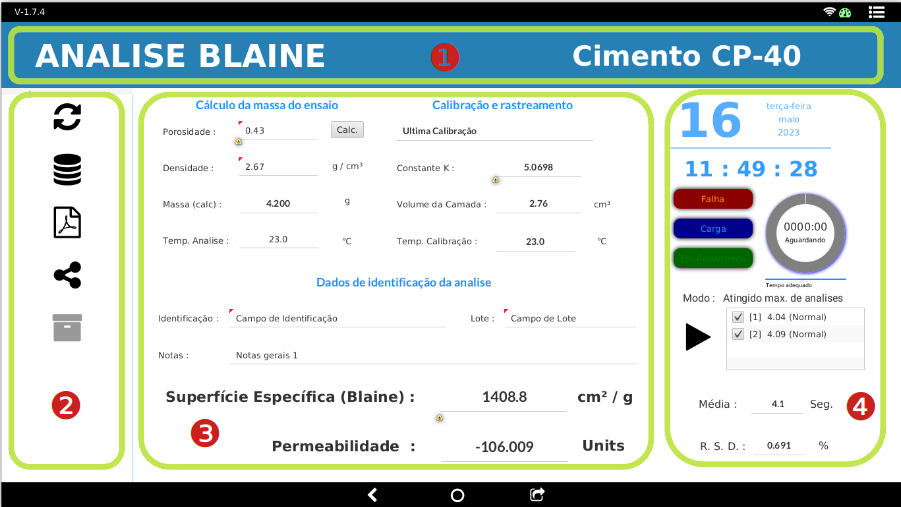
Although the presence, size and placement of the regions numbered above is entirely up to the application architect, the following guidelines are recommended:

Section ❶ - Identification Band: This region informs the analyst quickly and clearly about the identity of the current activity. It must be in the expected place and highlighted (at the top). It uses three methods to convey the message: ➀ Background colors (e.g. blue for routine analyses, green for calibrations) - ➁ Type of activity (e.g. permeability operations, fineness operations) label at the left and ➂ Type specialization or profile (e.g. fineness:cement CP40, analysis of fineness:clinker)> label at the right. As below:

Examples of Identification Bands

Section ❷ - Actions: This region must house the activity's direct command actions, both in terms of the workflow and in what provides mechanisms for interfacing with other functionalities provided by the operating system. They must therefore be of atomic action (do not need further clarification), be of immediate result and may be enabled by the context system of the control state machine. Taking the activity above as example, is possible to find actions like:

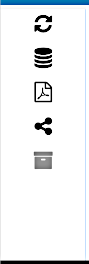
Reload Action: Almost ubiquitous in activities, this action resets the activity to a known configuration at each cycle of analyzes or operations. Performs reloading of the default parameters defined by the profile structure. The presence is recommended.

Store (Database) Action: Said - Send the result to storage in the database.

Report Action: Constructs a PDF document based on the structure defined by a report profile and the result of analysis or operations.

Export (share) Action: Constructs a data structure containing analysis results or operations and sends it to a sharing destination based on the export profile definition.

Archive Action: Said - Archive results or operations to a file. (grayed / disabled by the state machine context)

The feedback about the identification/meaning of the icon and his current stutus is provided by the ToolTip manager of the state machine when the mouse is hovering over.

Section ❸ - Input/Results Form: This region is where the operator establishes the operating parameters of the analytical task and obtains the results that is produced according to the particular methodology of the activity. We can note the following aspects as recommended:

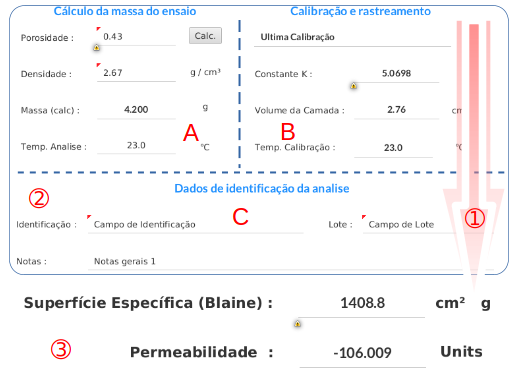
It should contain two clearly delimited sub-areas, one for inputs as in 2 and one for outputs as in 3.

Use bold notation to output data (intuitive identification).

Make the input data separated into functional areas such as A, B and C. Such functional areas should be demarcated by headers in the highlighted color of the set.

The data editing sequence must follow what is determined by the activity's focus sequence machine, so the position of the widgets follows this orientation, observing the western reading scan pattern (from left to right, from top to bottom) as in 1.

There should be no visual change (dynamic layout) in addition to the activity administration mechanisms ( context menus, configuration dialogs, etc).

Section ❹ - Status Painel: This region is reserved for the context information of the task in progress in the activity, the real-time feedback of the state of the instrument's sensors, the display of partial data and the immediate command of the essay. So we can find sub regions like:

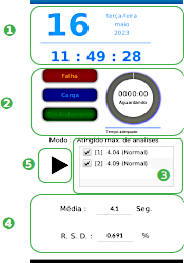
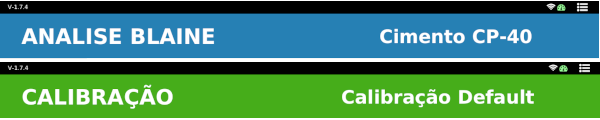
❶ Context information such as temporal data about the essay or its class (e.g. preliminary, correction, final essay).

❷ Gauges for tracking sensor results (e.g. LED indicators, timers, bargraphs).

❸ Partial results (replicas) of observations in the essay and their respective enabling commands.

❹ Raw/primary test results (which will be used in the analysis result after applying the calculation parameters).

❺ Essay activation command (Start/Stop/Pause).

This region is where the analyst pays most attention to the analysis routine and it is recommended that an extra dose of weighting between precision and synthesis be applied in the design of her architecture.